Online S-parameter viewer
You worked hard to create that fancy RF module and along the way you had to come up with innovative solutions to measure the characteristics of a few SMD components that play a crucial role in your design. All this involved making several S-parameter measurements. And at the end of the development process you want to publish your measurements using beautiful graphs that you can use directly in an article or datasheet.
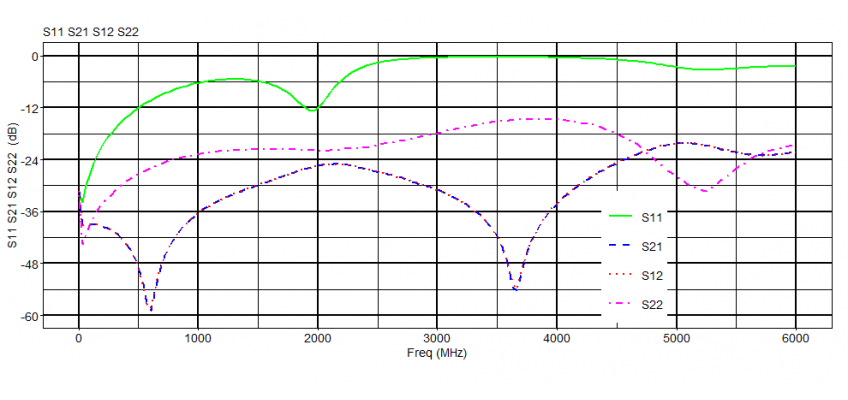
Use our S-parameter viewer to view your S-parameter files, produce good-looking graphs, and save them as a PNG image.
Features
The S-parameter tool has the following features
- Reads S-parameter files; supports DB, MA and RI formats
- Creates professional S-parameter graphs
- Auto scaling with manual overrides
- Customizes charts with legends, axis labels, and titles
- Exports charts to PNG image files
- Adjusts width and height of the PNG file
- Online web-based tool designed for both desktop and mobile devices
YouTube
There is a short S-parameter viewer instruction video on YouTube that shows all options of the S-parameter viewer. Or you can read this manual.
Manual
Supported file formats
The tool reads one-port (s1p) and two-port (s2p) S-parameter files and figures out the file format by interpreting the file. So, the file extension doesn’t matter. Decibel (DB), Magnitude (MA), and Real-Imaginary (RI) data formats are all supported. However, at the time of this writing, no phase information is displayed.
In the s1p format, the tool will check to see if there is a tag in the comment section that contains the name of the S-parameter. It looks for the tag “!@MeasurementType:Sxx” with xx equal to [11 | 21 | 12 | 22]. If this tag is not found, the tool doesn’t show the Y-axis label. The user can remedy this by setting the name in the “Overrule text label” section.
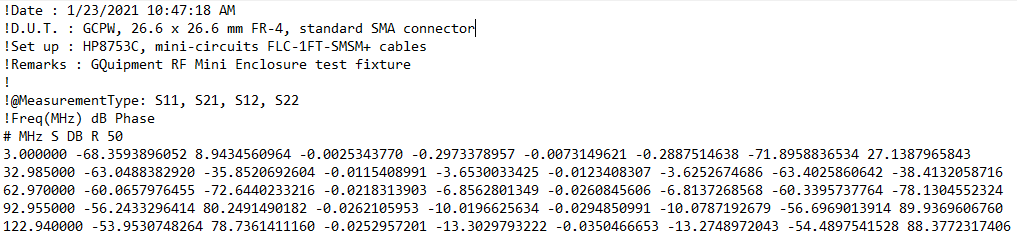
All comment lines that are parsed will be shown at the bottom of the web page.
Customizing charts
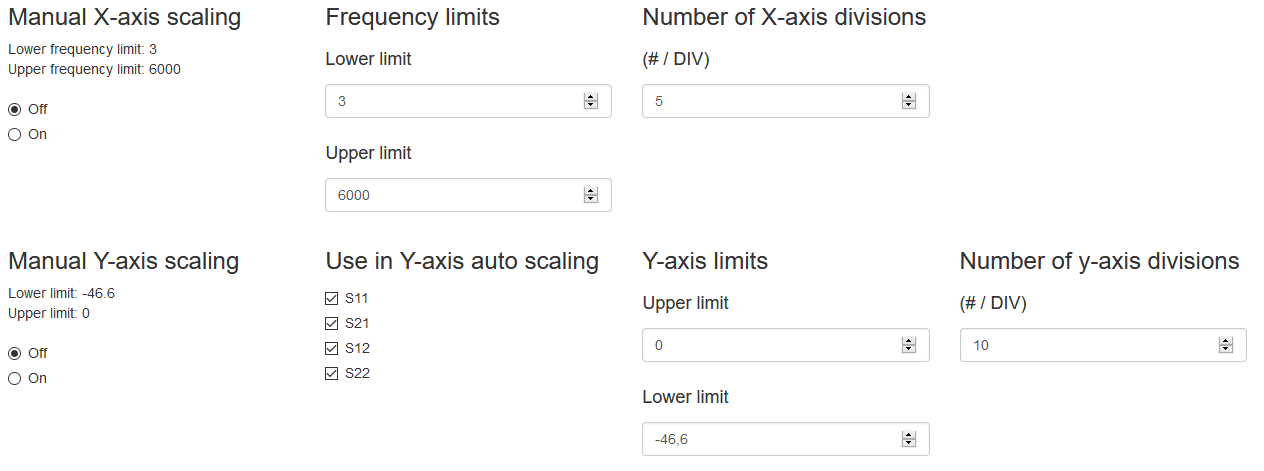
When a file is loaded, all its data is read, and a graph is shown right away. Throughout the session, changes made using the tool will be reflected in the graph immediately. By default, the graph’s axes are scaled automatically. This behavior can be overridden in the manual mode by setting X and Y axis limit values and the number of divisions of the graph (similar to the display of a network vector analyzer). In the auto-scale mode, you can select which S-parameters should be considered in the scaling algorithm. By default, all parameters are considered.
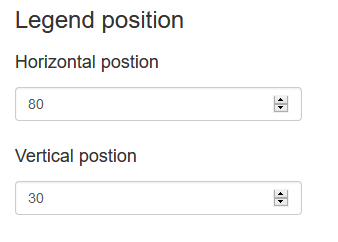
When s2p files are used, the tool will always generate a legend. Its position in the chart can be changed in the “Legend position” section.
The title and X-axis and Y-axis labels are all generated automatically using the names of the S‑parameters. The label names and the title can be overridden in the “Overrule text label” section.
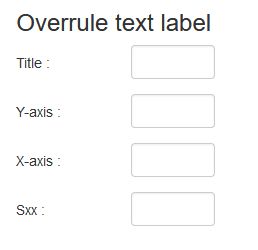
The “Sxx” overwrite parameter in the “Overrule text label” section is special-purpose field that has an effect only when using a one-port (s1p) S-parameter file. This field lets you overwrite the Y-axis label (S-parameter name) and title simultaneously.
Trace data
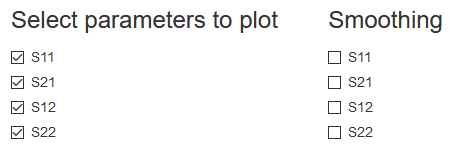
The S-parameter trace data that will be shown in the graph is selected in the “Select parameters to plot” section. By default, all parameters are displayed. Each individual S-parameter data trace can be smoothed by selecting it under “Smoothing.”
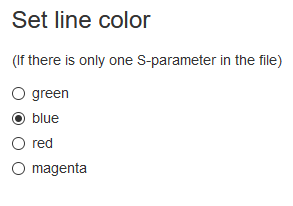
The color of the trace data is set automatically. In the one-port configuration, the color can also be set manually.
File Export
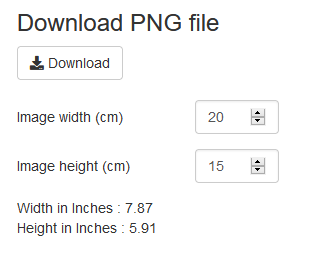
Use the “Download” button to download an PNG image. Set the image width and height so that you will have an image that is ready to use without post-processing. The dimensions are in centimeters (cm) and are also shown in inches.
Licencing
You can use this tool for free. If you do, you are agreeing that you use it at your own risk. No warranties of any kind are provided. If you like this tool, a link to this page would be appreciated.
If you have any comments about this tool, you can contact customer support.